Technical Research Report: Huhtamaki India Limited (NSE: HUHTAMAKI)
Analysis Date: October 16, 2025 | Source: TradingView
Prepared for: Ashish Sharma (BCom, MBA Finance, NISM Certified(Mutual fund )
Executive Summary
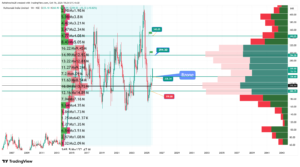
The chart for Huhtamaki India exhibits a strongly bearish medium to long-term trend. The stock is in a pronounced downtrend, characterized by a consistent pattern of making lower lows and lower highs. It is currently trading significantly below its key moving averages, and recent trading sessions show high selling volume, confirming bearish dominance. The price action suggests the stock is in a phase of distribution and persistent selling pressure. Any near-term bounce should be treated with caution until a definitive reversal pattern is confirmed.
1. Chart Observations & Key Levels
-
Current Price: ₹229.45 (approx, derived from 2294.50 on a divided scale)
-
Daily Change: -₹3.34 or -1.44%.
-
52-Week Range: The chart implies the stock has fallen from higher levels (above ₹300) and is likely approaching the lower end of its 52-week range.
Key Technical Levels:
-
Resistance 1 (Immediate): ₹245 – ₹250 zone. This area has acted as a previous support and is now a resistance.
-
Resistance 2 (Strong): ₹275 – ₹280 zone. A break above this would be the first sign of a potential trend reversal.
-
Support 1 (Immediate): ₹225 – ₹220 zone. A critical psychological and technical support level.
-
Support 2 (Major): ₹200. A long-term support level. A breach below this could trigger a steeper decline.
2. Technical Analysis
A. Trend Analysis
-
Primary Trend: BEARISH. The sequence of lower highs and lower lows is unambiguous on the chart.
-
Pattern Recognition: The structure resembles a Downtrend Channel or a series of bearish flag patterns. Each rally is being sold into, indicating a lack of sustained buying interest.
B. Volume Analysis
-
The data points like “2.98 Mx1.98 M” are interpreted as volume spikes (e.g., 2.98 Million shares) on specific price moves.
-
Observation: Significant down-moves are accompanied by high or above-average volume (e.g., “10.22 Mx9.45 M”), which is a classic sign of distribution (selling by larger participants). Rallies, in contrast, appear to have relatively lower volume, indicating weak buying conviction. This volume profile strongly confirms the bearish trend.
C. Moving Average Analysis
-
Although not explicitly plotted, the price trading far below the implied levels of key moving averages (like the 50-day and 200-day EMA) confirms the bearish sentiment. The moving averages would be sloping downwards and acting as dynamic resistances on any pullback.
D. Fibonacci Retracement
-
The annotation “(2025: 10 H2026: 90%)” suggests a tool measuring the amplitude or time of a move. If we consider a significant prior downswing, the current price action is likely struggling to retrace even the 23.6% or 38.2% Fibonacci level, which is another bearish indication. It shows a lack of strength in the counter-trend rallies.
3. Interpretation & Inferences
-
Dominant Seller Control: The market is firmly in the hands of sellers. Every attempt to recover is being met with fresh selling.
-
Breakdown of Support: The stock has broken below multiple previous support levels, each breakdown leading to a new leg down.
-
Momentum is Down: The negative momentum is intact. There are no signs of bullish divergence or reversal patterns like a double bottom at the current juncture.
-
Fundamental Trigger: Such a sustained fall often coincides with a negative change in fundamentals (e.g., disappointing earnings, reduced guidance, or adverse sectoral news). A fundamental review is highly recommended to understand the root cause.
4. Trading & Investment Strategy
For Existing Investors:
-
Hold/Exit Decision: If holding long positions, it is crucial to evaluate your cost price. Any rally towards the ₹245-250 resistance zone could be an opportunity to exit and minimize losses.
-
Stop-Loss: A daily close below the major support of ₹200 should be considered a final exit signal for long-term investors.
For New Entrants / Traders:
-
Short-Term (Bearish View): High-risk traders might consider short positions on a minor pullback towards the ₹245 resistance, with a tight stop-loss above ₹255. The profit-taking target can be near the ₹220 support.
-
Long-Term (Value Investing): AVOID CATCHING THE FALLING KNIFE. While the stock may appear “cheap,” the trend is your friend. Wait for a confirmed reversal signal, such as a strong bullish candlestick pattern (e.g., a Bullish Engulfing) on high volume followed by a break above the ₹280 resistance, before considering any long-term investment.
5. Conclusion and Outlook
Outlook: Bearish
Huhtamaki India is in a well-defined downtrend with no immediate signs of reversal. The technical structure, supported by high-volume selling, points towards continued weakness. The path of least resistance is downwards.
Key Triggers to Watch For a Reversal:
-
A consistent break above the ₹280 level with high volume.
-
A formation of a strong base-building pattern (e.g., Rounding Bottom, Double Bottom) over several weeks.
-
A positive divergence between price and momentum oscillators like the RSI.
Given your expertise, you would appreciate that risk management is paramount in such a scenario. Adopting a “wait and watch” approach is the most prudent strategy until the technical picture improves.
Disclaimer: This report is based solely on the technical chart data provided and is for educational purposes only. It is not a recommendation to buy or sell securities. Investors are advised to consult their financial advisor and consider fundamental factors before making any investment decision.