Technical Analysis: Aurobindo Pharma Ltd. (AUROPHARMA)
Analyst: Ashish Sharma, B.Com, MBA Finance, NISM Certified
Date: October 9, 2025
1. Executive Summary
The chart for Aurobindo Pharma exhibits a strong and sustained long-term bullish trend, characterized by a series of higher highs and higher lows. After a significant rally from the lows of 2024, the stock is currently in a phase of consolidation or a potential short-term pullback. The overall structure remains bullish, with a critical support zone identified around the ₹1,150 – ₹1,200 level. A decisive break above the recent highs near ₹1,325 is required to signal the next leg of the uptrend.
2. Chart Overview & Price Action
-
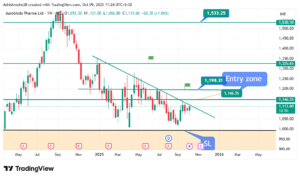
Current Price: ₹1,113.60 (as of close on the chart date)
-
52-Week High/Low: The chart indicates a high near ₹1,325.65 and a low around ₹900.00 over the visible period.
-
Trend: The primary long-term trend is unequivocally BULLISH. The stock has advanced from a low near ₹900 (approx. May 2024) to a high of ₹1,325.65, representing a gain of over 47%.
-
Recent Action: Following the peak at ₹1,325.65, the price has corrected and is currently trading near ₹1,113.60. This move appears to be a pullback within the larger uptrend and is testing a key support area.
3. Critical Technical Levels
-
Resistance Levels:
-
Immediate Resistance: ₹1,200 – ₹1,210 (previous support, now turned resistance).
-
Major Resistance: ₹1,325 – ₹1,330 (the all-time high recorded in 2025). A conclusive break and close above this level could open the door for further upside towards ₹1,400 and beyond.
-
Psychological Resistance: ₹1,350 and ₹1,400.
-
-
Support Levels:
-
Immediate & Strong Support: ₹1,146.35 – ₹1,150 (as marked by the “Entry zone” on the chart). This zone has acted as both support and resistance in the past and is critical for the bullish case.
-
Major Support: ₹1,050 – ₹1,000. A break below the immediate support zone could lead to a deeper correction towards this area.
-
Long-term Trend Support: The rising trendline drawn from the 2024 lows (not explicitly drawn but implied) would also provide support, currently residing near the ₹1,050 level.
-
4. Technical Analysis & Interpretation
-
Consolidation Phase: The price action since hitting the ₹1,325 high suggests the stock is undergoing a healthy consolidation. This is a typical market behavior after a strong rally, allowing the stock to work off overbought conditions and build a base for the next potential move higher.
-
Support Test: The current price is testing the crucial support zone around ₹1,150. The reaction at this level is key. A strong bounce from here would confirm the strength of the underlying uptrend.
-
Volume Analysis: While volume data is not explicitly visible, the structure suggests that the up-moves were likely on higher volume compared to the down-moves, which is a characteristic of a healthy bullish trend.
5. Conclusion and Outlook
Bullish, with a near-term cautious stance. The long-term chart structure is overwhelmingly positive. The current decline is viewed as a corrective pullback within a primary bull market.
-
Bullish Scenario: A hold above the ₹1,150 support zone, followed by a rebound and a break above ₹1,210, would signal that the correction is over and the next upward wave has begun. The initial target would be a re-test of ₹1,325.
-
Bearish Scenario (Risk): A decisive break and close below the ₹1,146 support would indicate weakness and could trigger a deeper correction towards ₹1,050 – ₹1,000. This would invalidate the immediate bullish outlook and suggest a longer period of consolidation is needed.
6. Recommendation
-
For Existing Investors: Hold positions with a stop-loss on a closing basis below ₹1,140.
-
For New Investors: The current pullback to the ₹1,150 – ₹1,160 zone offers a potential accumulation opportunity for the long term. It is prudent to accumulate in a staggered manner. A strict stop-loss should be maintained below ₹1,140.
-
For Traders: Look for bullish reversal patterns (like a bullish engulfing or hammer candle) around the ₹1,150 support for a tactical long trade with a target of ₹1,210 and then ₹1,260.
Disclaimer: This analysis is based solely on the technical chart provided and is for educational purposes only. It does not constitute a recommendation to buy or sell securities. Investors are advised to consult with their financial advisor and consider fundamental factors before making any investment decision.
Analyst: Ashish Sharma