📌 Stock Research Report: Cyient Ltd—Technical Outlook & Trading Plan
Research by: Ashish Sharma (B.Com, MBA Finance, PGDBM, NISM)
Date: 3 December 2025
🔎 Introduction
Cyient Ltd has been consolidating for several months, and the stock is now approaching a crucial technical zone where buyers have historically shown strong interest. Based on price action, Smart Money Concepts (SMC), volume profile, and structural levels, the stock appears to be preparing for a potential bullish reversal in the coming weeks.
This report breaks down the market structure, identifies safe-buy zones, and highlights potential targets with strong confluence.
📈 Technical Analysis Overview
1️⃣ Market Structure
-
The stock has been forming Lower Highs (LH) and Lower Lows (LL) for months, indicating a sustained downtrend.
-
Recently, a Break of Structure (BOS) has been observed, suggesting early signs of buyers stepping in.
-
Price is currently trading near the discount zone, where institutional buying typically happens.
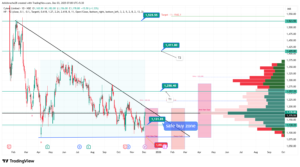
2️⃣ Safe Buy Zone (High Probability Zone)
The chart shows a clearly defined “Safe Buy Zone” between:
₹1,082 – ₹1,130
This zone aligns with:
-
A key demand zone
-
Deep Crab harmonic completion
-
Anti-Neo Star pattern support
-
Heavy volume profile support
This makes it a strong area where long positions may be initiated with minimal downside risk.
3️⃣ Important Levels
🔹 Entry Level
-
₹1,131.85 – A key pivot where confirmation buyers may step in.
4️⃣ Upside Targets
Based on structural fib targets, liquidity zones, and volume gaps:
🎯 Target 1: ₹1,258 – ₹1,260
-
Confluence of equilibrium zone
-
Breakdown retest area
-
Volume pocket resistance
🎯 Target 2: ₹1,411 – ₹1,412
-
Major liquidity pool
-
Previous strong high
-
Premium zone
🎯 Final Target: ₹1,523 – ₹1,525
-
Historical supply zone
-
Strong institutional selling region
-
Chart’s upper liquidity sweep
If momentum remains strong, this zone may act as the final upside barrier in this bullish wave.
5️⃣ Stop Loss
To protect capital:
🔻 SL below ₹1,080
This is just below the discount-zone and invalidates the bullish harmonics if breached.
📊 Volume Profile Insights
-
Significant accumulation is visible at ₹1,150–₹1,200, confirming that larger players are actively entering positions.
-
A volume gap appears between ₹1,240–₹1,265, meaning price may move quickly through this region once momentum builds.
📘 Conclusion
Cyient Ltd is poised for a potential trend reversal after a prolonged correction. With strong support, harmonic completion, and bullish SMC signals, the stock appears attractive in the ₹1,082–₹1,130 safe-buy zone, offering a favorable risk-to-reward setup.
If price sustains above ₹1,131.85, the stock may head toward ₹1,258, ₹1,412, and ultimately ₹1,523+.
This analysis suggests a medium-term bullish outlook, provided global and domestic market sentiments remain stable.
📣 Summary (Short & Attractive)
Cyient Ltd – Safe Buy Zone Identified! 🔥
Research by: Ashish Sharma (B.Com, MBA Finance, PGDBM, NISM)
Cyient is showing strong signs of a trend reversal. The stock is inside a high-probability buying zone between ₹1,082–₹1,130, supported by smart-money concepts and strong volume.
Targets:
👉 T1: ₹1,258
👉 T2: ₹1,411
👉 T3: ₹1,523
Stop Loss: Below ₹1,080
Technical structure, BOS, volume profile, and harmonic completion indicate a potential strong upside rally.
(Educational purpose only — not investment advice.)